
Mastering Databricks Costs with Native Tools: A Guide for Data Teams

Introduction
This blog shares practical experience in tracking and managing costs efficiently in the Databricks platform using native capabilities. We'll explore how to leverage Audit Logs and Spark Monitoring tools to build automated cost-tracking systems.
What this blog covers:
Key challenges in Databricks cost management
Using native tools for cost tracking
Building automated reporting pipelines
Real business impact of proper cost management
What this blog doesn't cover:
Cost optimization techniques
Workload optimization strategies
Infrastructure management
For infrastructure and cluster management best practices, check out the technical guide on using Terragrunt to manage Databricks platform.
Let's dive into the real challenges teams face with Databricks cost management.
The Cost Control Challenge
When scaling Databricks across an organization, teams typically face these critical challenges:
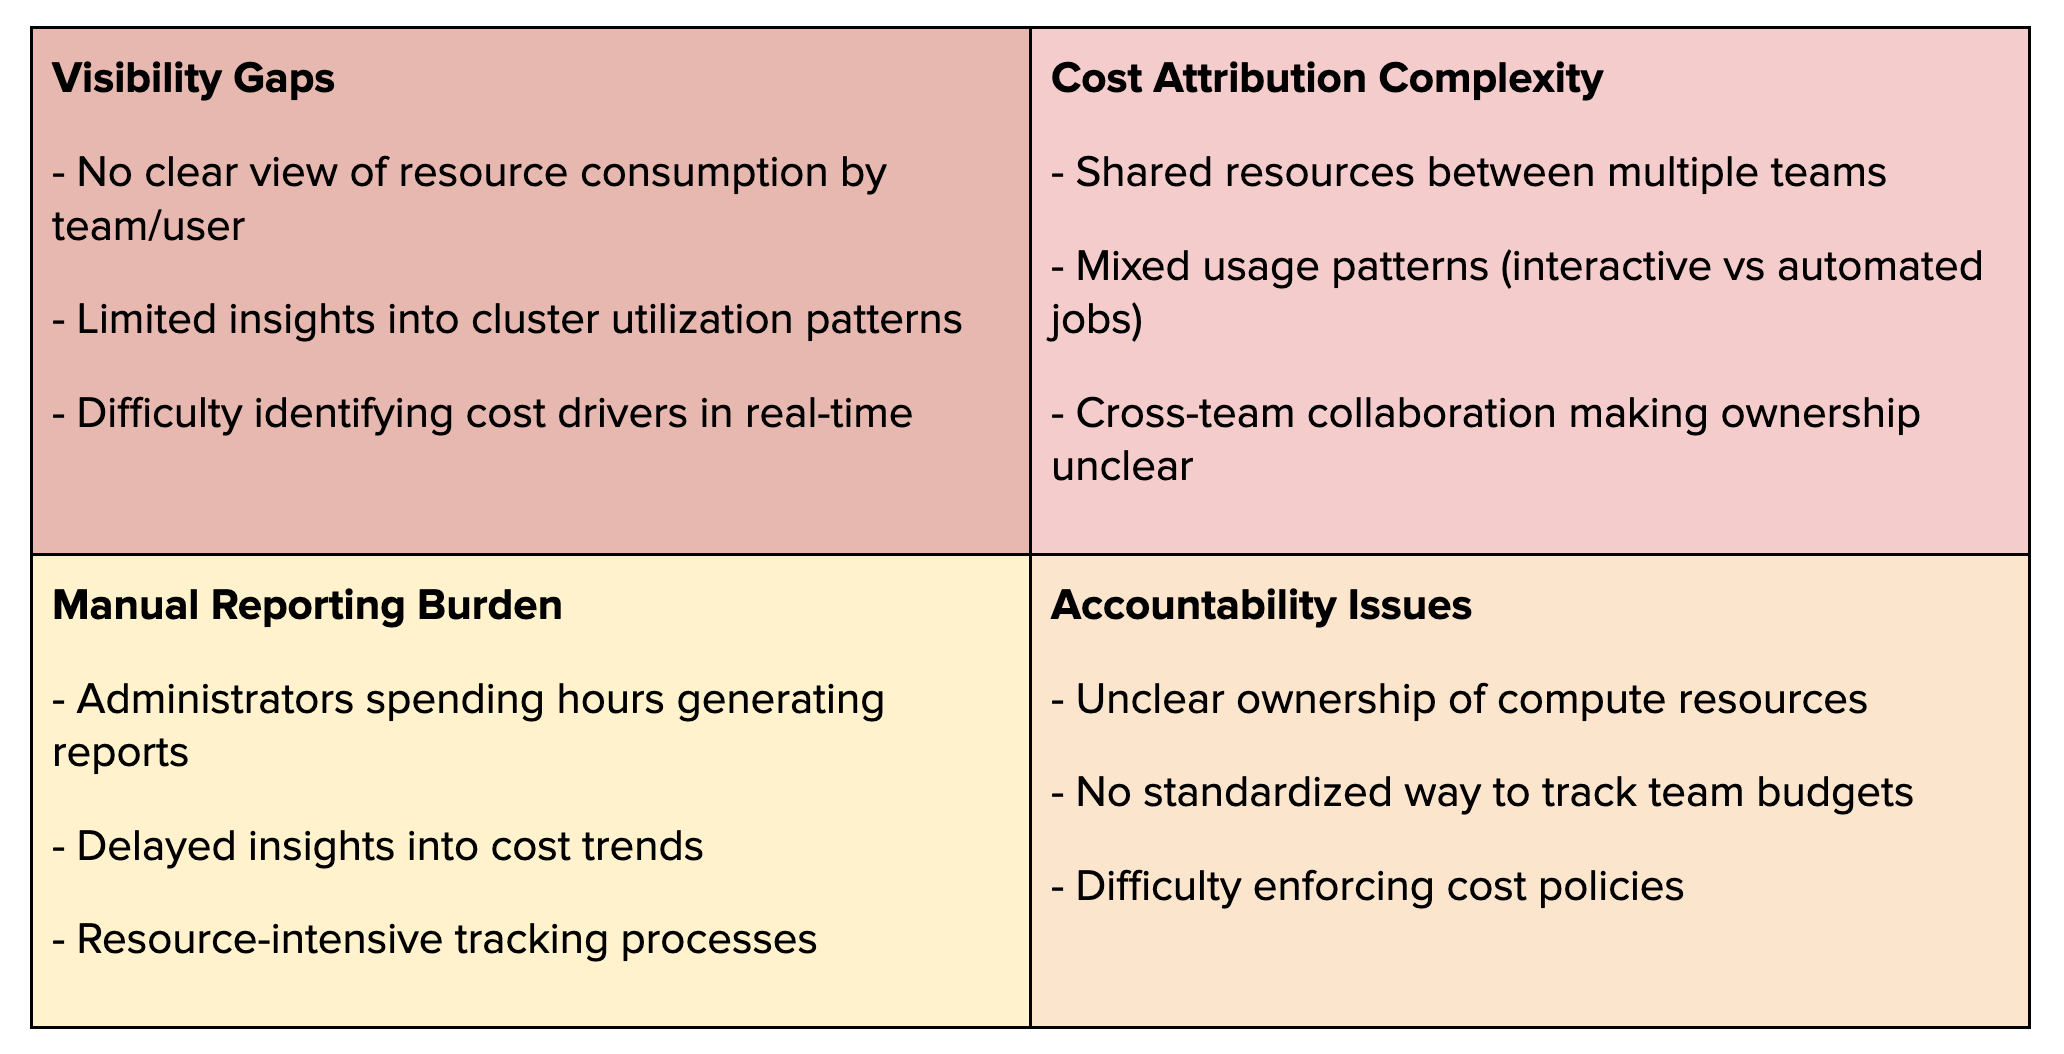
While Databricks provides cluster tagging capabilities to mark ownership (like tagging a cluster with "owner:team_a"), the reality is more complex:
Shared Cluster Scenarios
Team A owns a cluster but shares it with Teams B and C
Who's responsible for the DBU consumption?
Which team's budget should be charged?
How do we track individual usage within the shared resource?
Budget Planning Challenges
Budget owners face critical questions:
How do we verify actual team consumption for accurate reporting?
What data supports next year's budget planning?
How do we split costs when resources are shared?
The Management Dilemma
Finance needs accurate attribution for chargebacks
Leadership needs data for capacity planning
These real scenarios highlight why traditional tagging and manual tracking fall short, setting the stage for why we need a more sophisticated approach using native tools.
Hidden Gems: Your Cost Tracking Foundation
The key to mastering Databricks costs lies in two powerful data sources: Audit Logs as your workspace's activity tracker and Spark Monitoring as your resource consumption detector. Together, they form a complete picture of who's using what, when, and how much - exactly what you need for effective cost management.
Databricks Audit Logs
Databricks Audit Logs provide comprehensive tracking of all activities within your workspace. These logs capture essential information about cluster usage, notebook executions, and user interactions - making them invaluable for cost attribution.
Setting up Audit Logs
To enable Audit Logs, configure log delivery in your Databricks account by setting up a storage destination (like an S3 bucket). This same storage will collect both your audit logs and billing CSV files, centralizing your cost management data.
You can also enable Audit Logs using Terraform with the databricks_mws_log_delivery resource (full code here)
resource "databricks_mws_log_delivery" "audit_logs" {
  provider                 = databricks.mws
  account_id               = var.databricks_account_id
  credentials_id           = databricks_mws_credentials.log_writer.credentials_id
  storage_configuration_id = databricks_mws_storage_configurations.log_bucket.storage_configuration_id
  delivery_path_prefix     = "audit-logs"
  config_name              = "Audit Logs"
  log_type                 = "AUDIT_LOGS"
  output_format            = "JSON"
}
For detailed information about Audit Logs capabilities and setup, refer to the official Databricks documentation.
Let's dive into the specific components of Audit Logs that are crucial for cost-tracking
Billable Usage Data
The most valuable component for cost tracking is the Billable Usage CSV files, providing hourly usage data at the cluster level. These files track:
ClusterID and name
DBU consumption
Cluster creator information
Cluster tags
This data enables clear cost attribution through:
Job Clusters: Creator = Job RunAs user
Interactive Clusters and Other Usages: Owner tag identifies team responsibility
Notebook Command Execution Logs
The notebook runCommand logs provide granular insights into interactive cluster usage:
Captures each command execution in notebooks
Records exact user running the command
This data is particularly valuable because:
Shows actual users in shared clusters. Note: Job clusters don't require this level of tracking since they operate under a single user context, making cost attribution 100% straightforward through the job RunAs.
Helps attribute costs in multi-user scenarios
Provides command-level usage patterns
Note: Job clusters don't require this level of tracking since they operate under a single user context, making cost attribution 100% straightforward through the job RunAs.
Here's how we calculate individual user costs from shared cluster usage:
User Usage % = User Command Runtime in Hour X / Total Command Runtime from All Users in Hour X

------------

User DBUs = Cluster DBUs in Hour X × User Usage %
For example:
At 1 PM, for a shared cluster:
Total DBUs consumed = 10
User A runtime = 30 minutes
User B runtime = 20 minutes
User C runtime = 10 minutes
Total runtime = 60 minutes
User A's cost:
Usage percentage = 30/60 = 50%
DBUs consumed = 10 × 50% = 5 DBUs
This precise calculation enables fair cost attribution in shared cluster environments.
Spark Monitoring with Iris
Iris is our end-to-end Spark monitoring solution that combines powerful open-source tools:
Uber JVM Profiler for JVM metrics
SparkMeasure for Spark performance data
Custom metadata collector for cost tracking
As detailed in Grab's Engineering Blog, Iris provides deep visibility into Spark application performance and resource utilization.
Node-level metrics
For cost tracking, Iris captures crucial node-level metrics:
Instance type (e.g., r5.4xlarge, i3.8xlarge)
Node specifications (CPU cores, Memory GB)
Node lifecycle (Spot vs On-Demand instances)
Node runtime (precise start and termination timestamps)
Why This Matters?
In Databricks classic mode, your team manages the data plane and pays AWS EC2 costs directly. While Databricks tracks DBU usage, it doesn't show:
Total number of nodes per cluster
Which nodes are Spot vs On-Demand
Actual infrastructure costs
Tracking API/Service Account Costs
Iris leverages SparkMeasure to capture SparkListenerThriftServerSession events, giving us precise visibility into JDBC/ODBC connections. Here's what we track:
Thrift session creation and close times.
User attribution per session
This tracking method works because:
Every JDBC connection creates a thrift session
Each session is tied to a specific user
Runtime metrics are captured automatically
Just like notebook command tracking, we can calculate user-level cost attribution for API/service workloads by measuring session runtime and combining it with cluster usage data.
Normalizing Compute Costs: DBIU (Databricks Infra Unit)
The Challenge: teams use diverse instance types based on their needs:
R instances for standard Spark workloads
C instances for compute-intensive tasks
I3 instances for high I/O SQL workloads
Fleet instances in Databricks further complicate this by mixing different worker node types (r5.2xlarge, r6i.2xlarge, r5n.2xlarge) in a single cluster.
The Solution: DBIU
We standardize infrastructure costs using the xlarge model, similar to DBU calculations:
1 DBIU = 4 CPUs + 32GB Memory (xlarge equivalent)Examples:
r5.2xlarge (8 CPU, 64GB) = 2 DBIU per hour
r5.xlarge (4 CPU, 32GB) = 1 DBIU per hour
r5.4xlarge (16 CPU, 128GB) = 4 DBIU per hour
This standardization makes it simple to:
Calculate costs across different instance types
Handle Fleet instance clusters
Provide clear cost metrics to teams
Pricing Ratio:
On-Demand DBIU = 3 × Spot DBIUThis 3x multiplier reflects typical price differences between On-Demand and Spot instances across our infrastructure.
Example Calculations:
r5.2xlarge (Spot) = 2 DBIU
r5.2xlarge (On-Demand) = 6 DBIU
We've established a comprehensive cost-tracking foundation using Databricks Audit Logs and Iris monitoring. Audit Logs provide DBU consumption and user-level notebook usage, while Iris captures detailed infrastructure metrics including node types and lifecycles. Combined with our DBIU standardization (normalizing compute costs across instance types and Spot/On-Demand usage), we now have all the necessary data points to track costs accurately across teams and workloads. Let's explore how to build a data pipeline that brings these components together.
Building Your Cost-Tracking Pipeline
Before diving into our pipeline architecture, let's note that you'll need audit log processing in place. You can either:
Set up your audit log pipeline following Databricks' guide on workspace monitoring with audit logs
Or, if you're using Unity Catalog, access pre-processed audit logs directly from system tables as documented in the audit logs system tables guide
For Spark monitoring, while we use Iris (combining custom JVM profiler and sparkMeasure), you can implement any monitoring solution that captures the key metrics we discussed:
Node instance types and lifecycles
Runtime tracking
Thrift session monitoring
Resource utilization
We plan to open-source Iris in the future, making it available for direct installation and use. Until then, focus on capturing these essential metrics using your preferred monitoring tools.
Design

Our cost-tracking pipeline processes data through three essential layers: Raw Cost captures hourly usage data combining DBUs and DBIUs per user per cluster, User Cost aggregates daily consumption patterns for individual users, and Team Cost provides monthly summaries for budget tracking and team comparisons. This structure enables both granular analysis and high-level cost management.
Let's dive into implementing each layer.
Raw Cost
We combine three data sources into hourly cost records:
Billable CSV: DBU consumption
Audit Logs: Notebook usage
Iris Metrics: Infrastructure data
Output example:
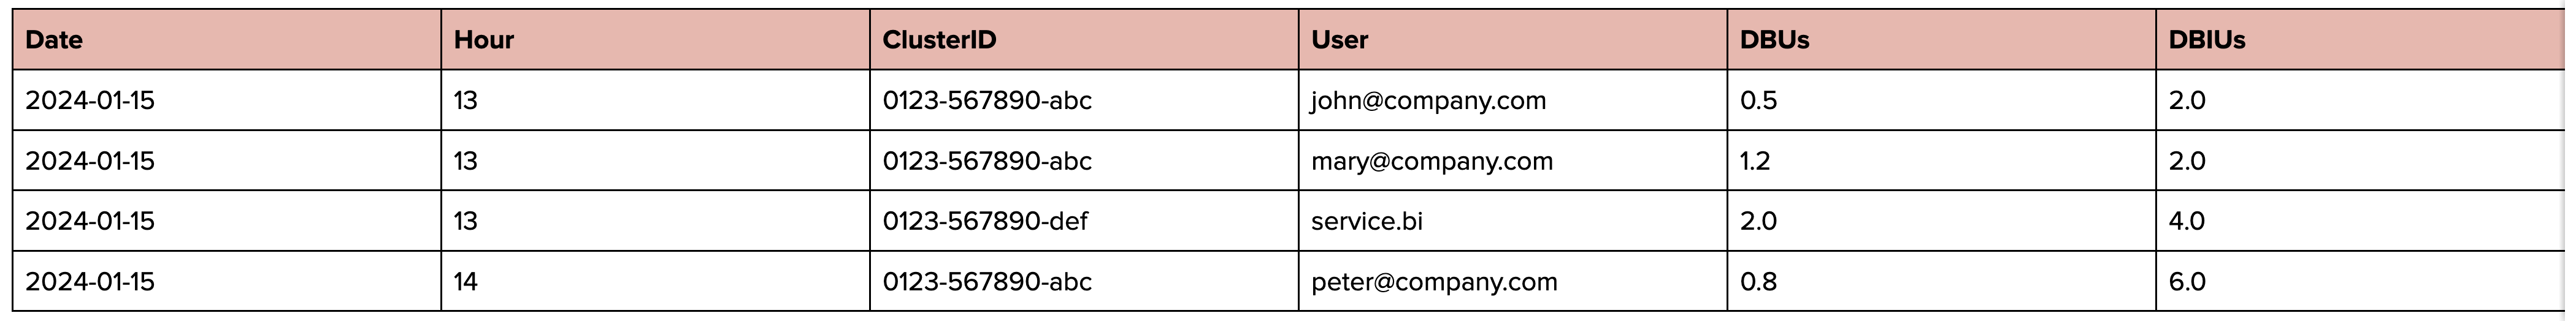
While this blog focuses on user-level cost tracking, the Raw Cost layer also supports cost analysis at job and cluster levels, providing flexibility for different reporting needs.
User Cost
The User Cost layer aggregates our raw hourly data into meaningful daily user metrics:
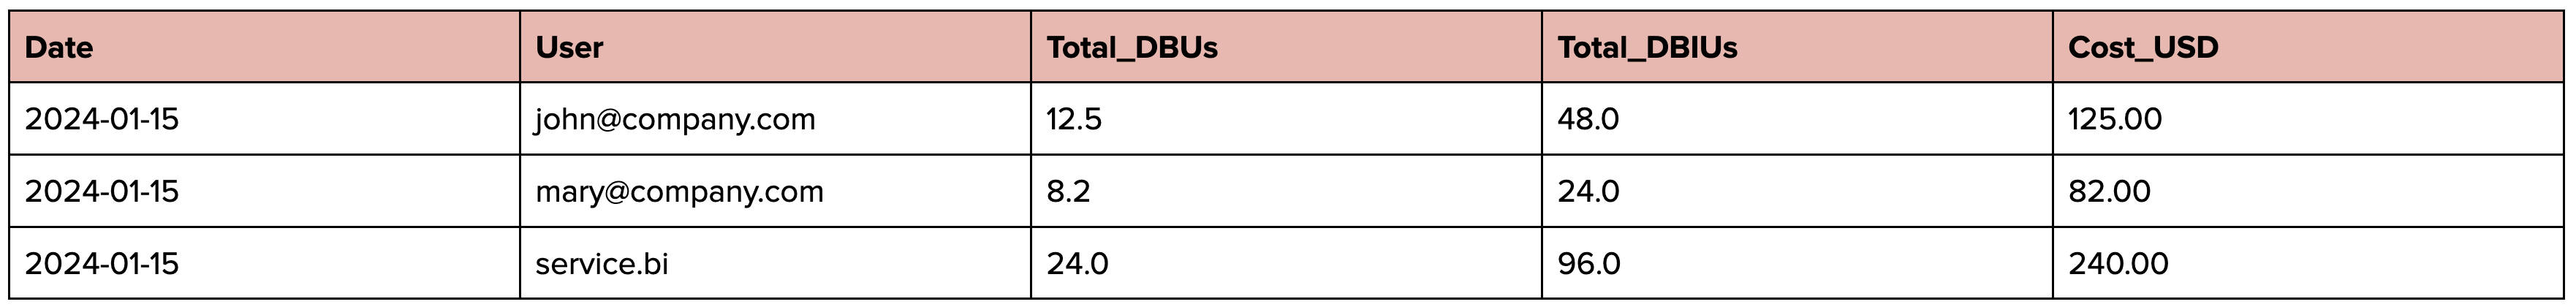
This view enables:
Daily user consumption tracking
Cost trend analysis
Resource utilization patterns
Team Cost
The Team Cost layer can be flexible based on your tracking needs:
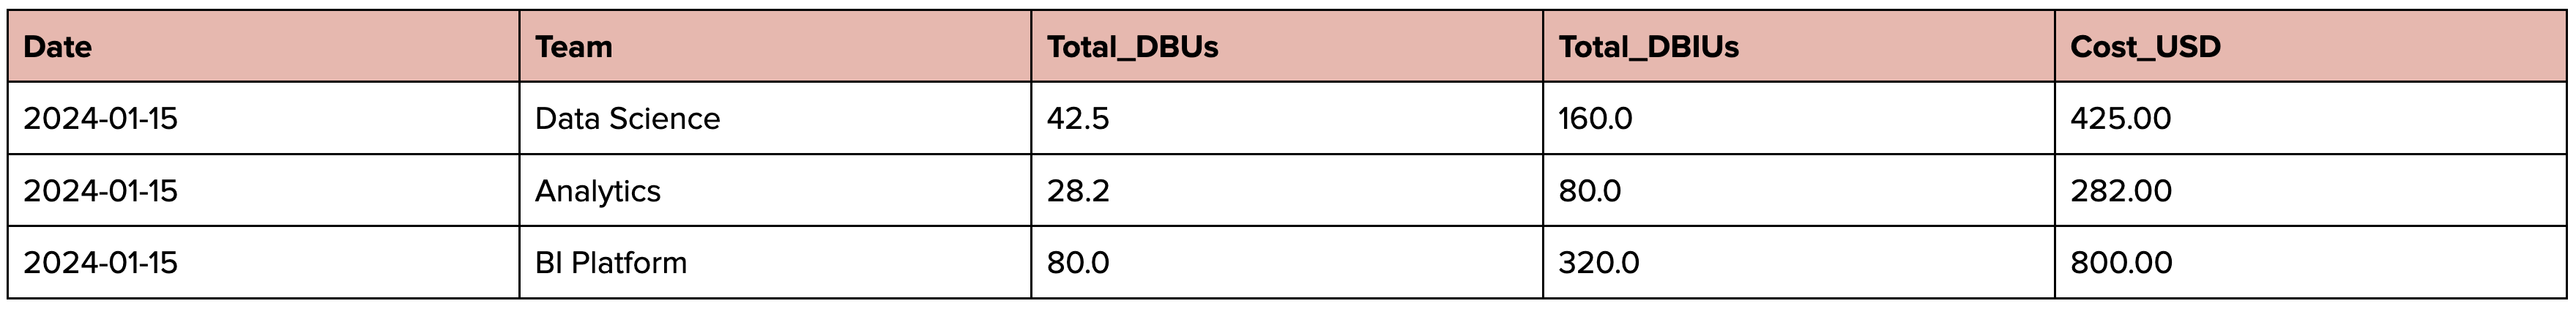
The key to accurate team cost attribution lies in our user-to-team mapping approach. By first capturing detailed user-level costs and then joining with team membership data, we solve the shared cluster attribution challenge elegantly.
Example user-team mapping:
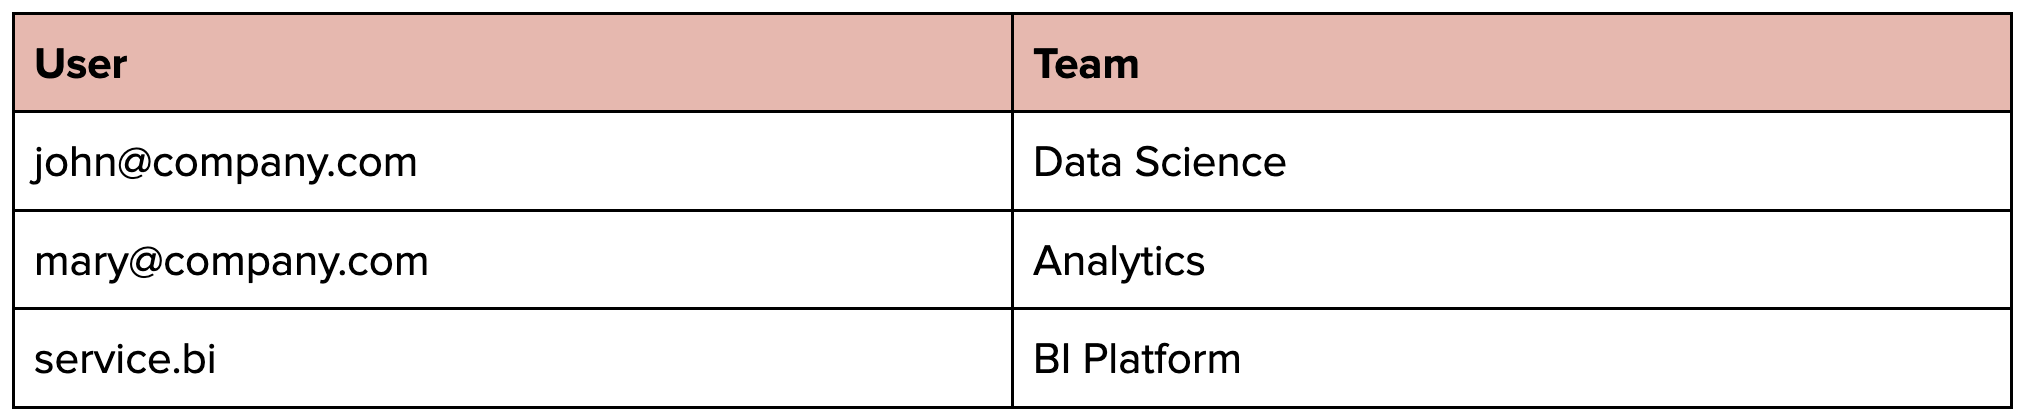
This mapping enables:
Clear cost attribution in shared clusters
Accurate team billing
Proper budget allocation
Cross-team resource sharing without losing cost visibility
Now teams can freely collaborate using shared resources while maintaining transparent cost tracking.
Impact and Results
Our cost-tracking pipeline delivers significant business value:
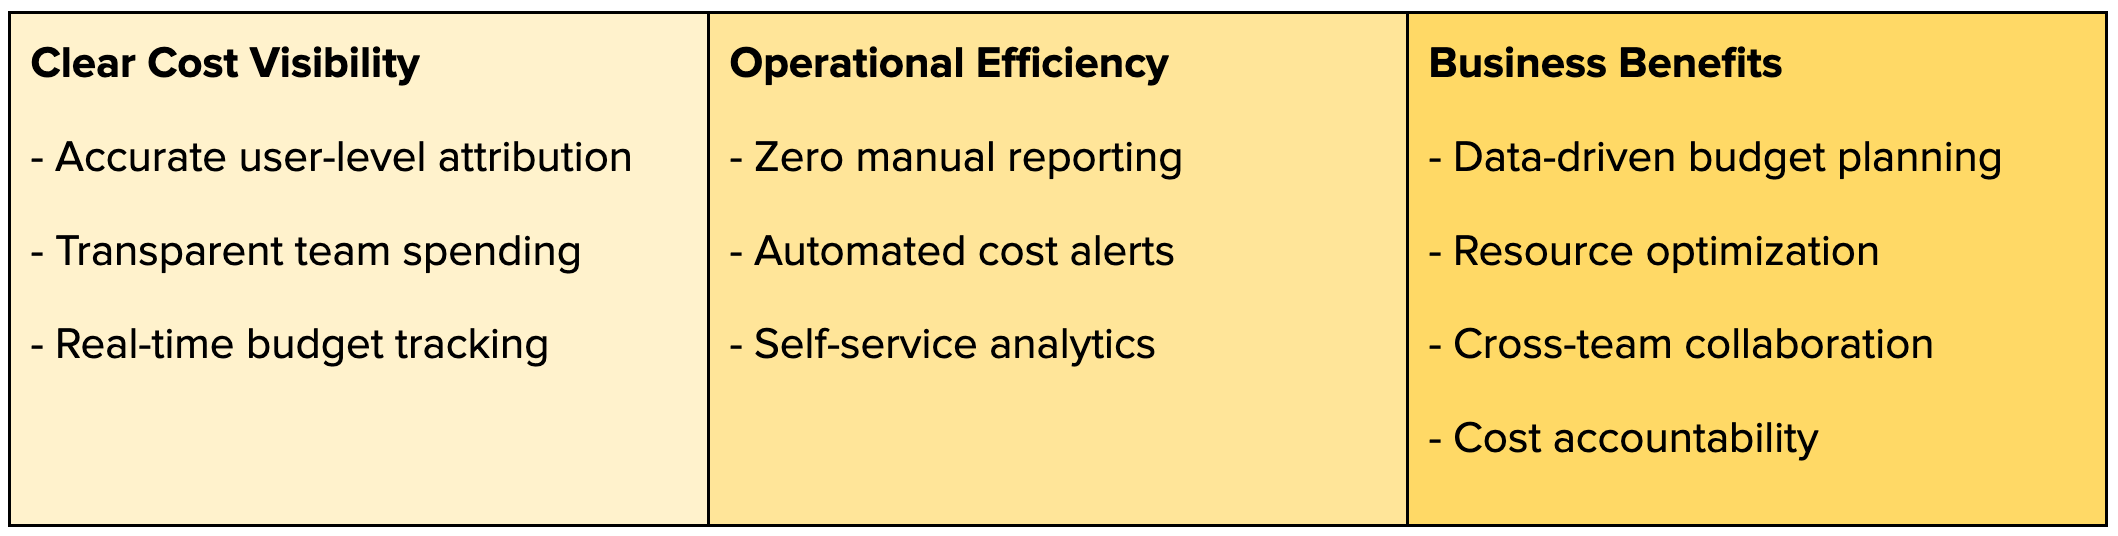
From an operational perspective, daily dashboards and automated alerts enable immediate detection and investigation of cost spikes, replacing manual ad-hoc queries.
For users, direct access to cost data in the data lake empowers teams to perform their analytics and create custom reports without relying on central teams.
Conclusion
Building a comprehensive cost-tracking system using Databricks' native tools - Audit Logs and Spark monitoring - enables organizations to gain clear visibility into their Databricks usage. By combining these data sources and implementing standardized cost units (DBIU), teams can accurately track and attribute costs across shared resources. The resulting pipeline delivers both operational efficiency through automated monitoring and user autonomy through self-service analytics.
While Databricks Serverless offers promising features for infrastructure management and cost tracking, the principles and approaches shared here remain valuable for teams managing costs at scale. The foundation of user-level tracking, standardized cost units, and automated pipelines can adapt to evolving platform capabilities. We hope this practical guide helps your team implement better cost management practices using data you already have.